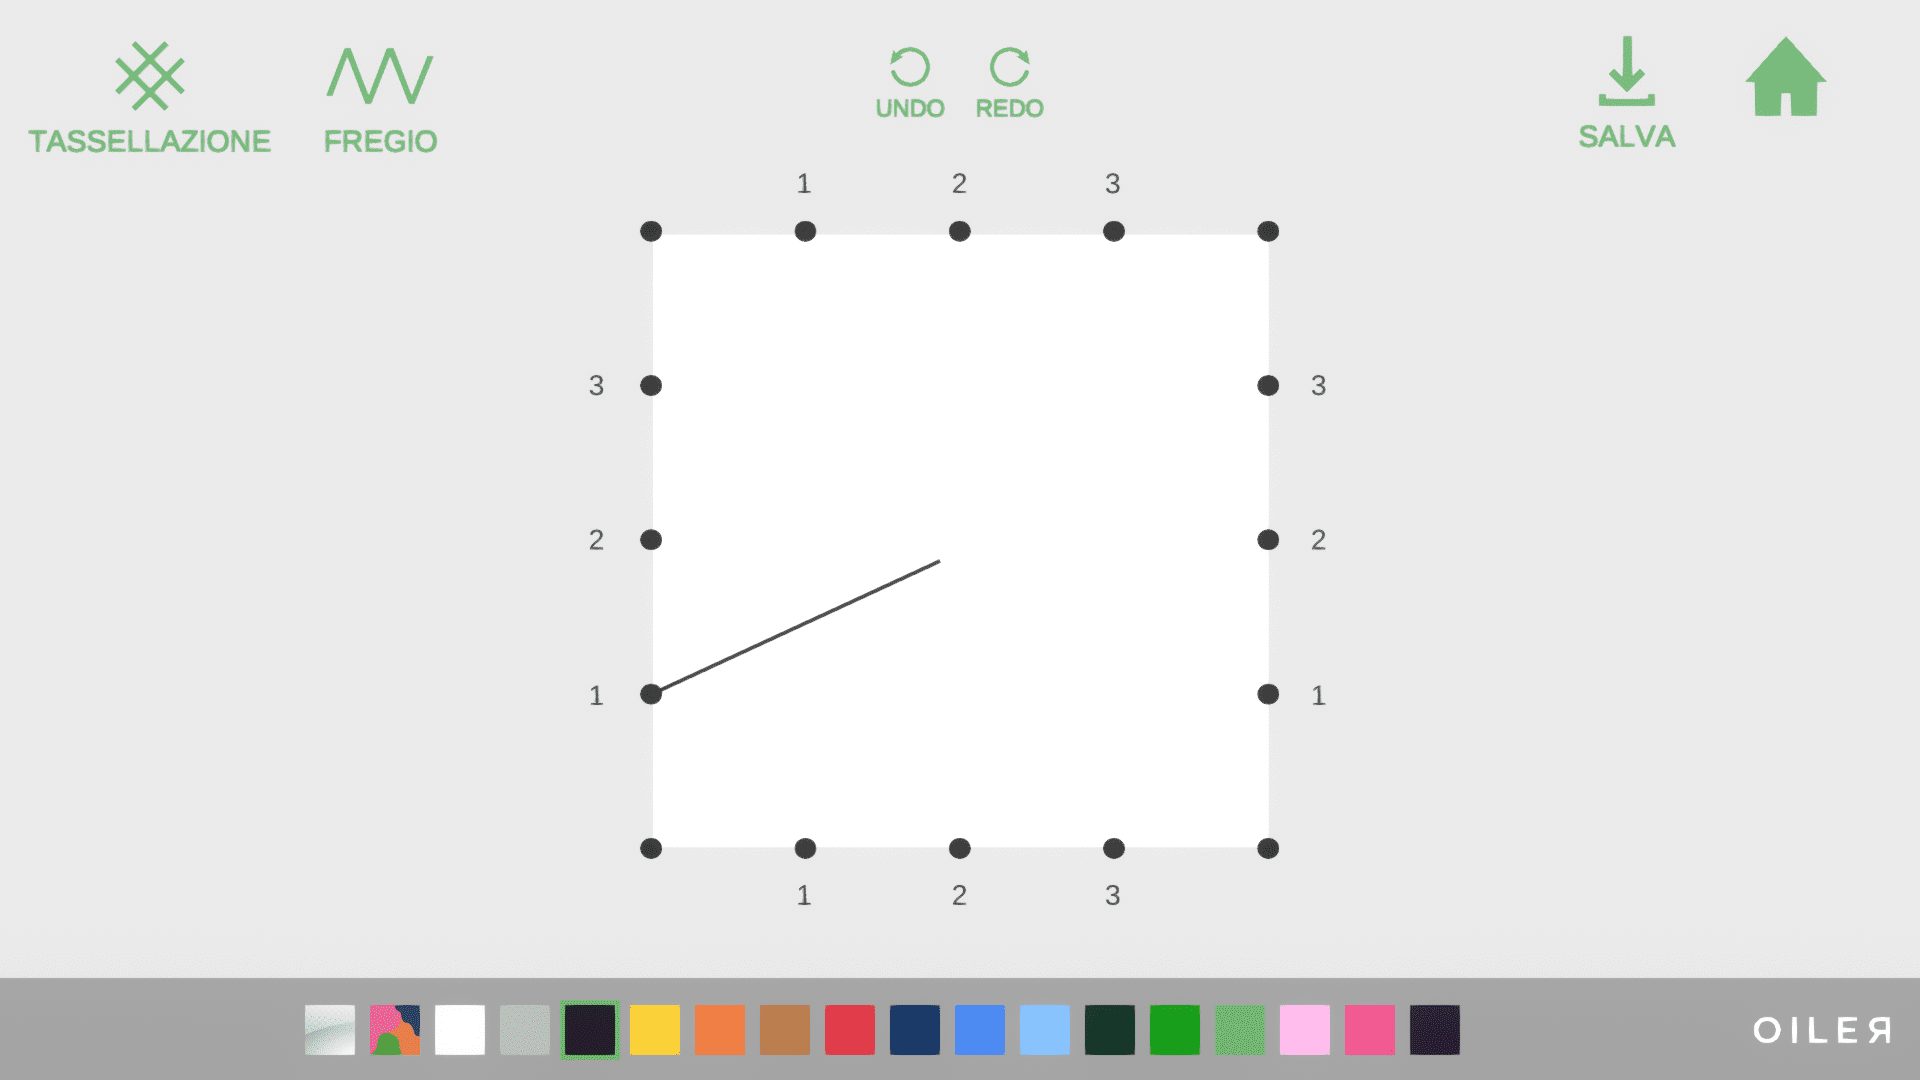
TALES is a software that allows you to create your own personal configurations by using straight lines to connect points on the edge of a shape and colouring in the resulting divisions of the plane.
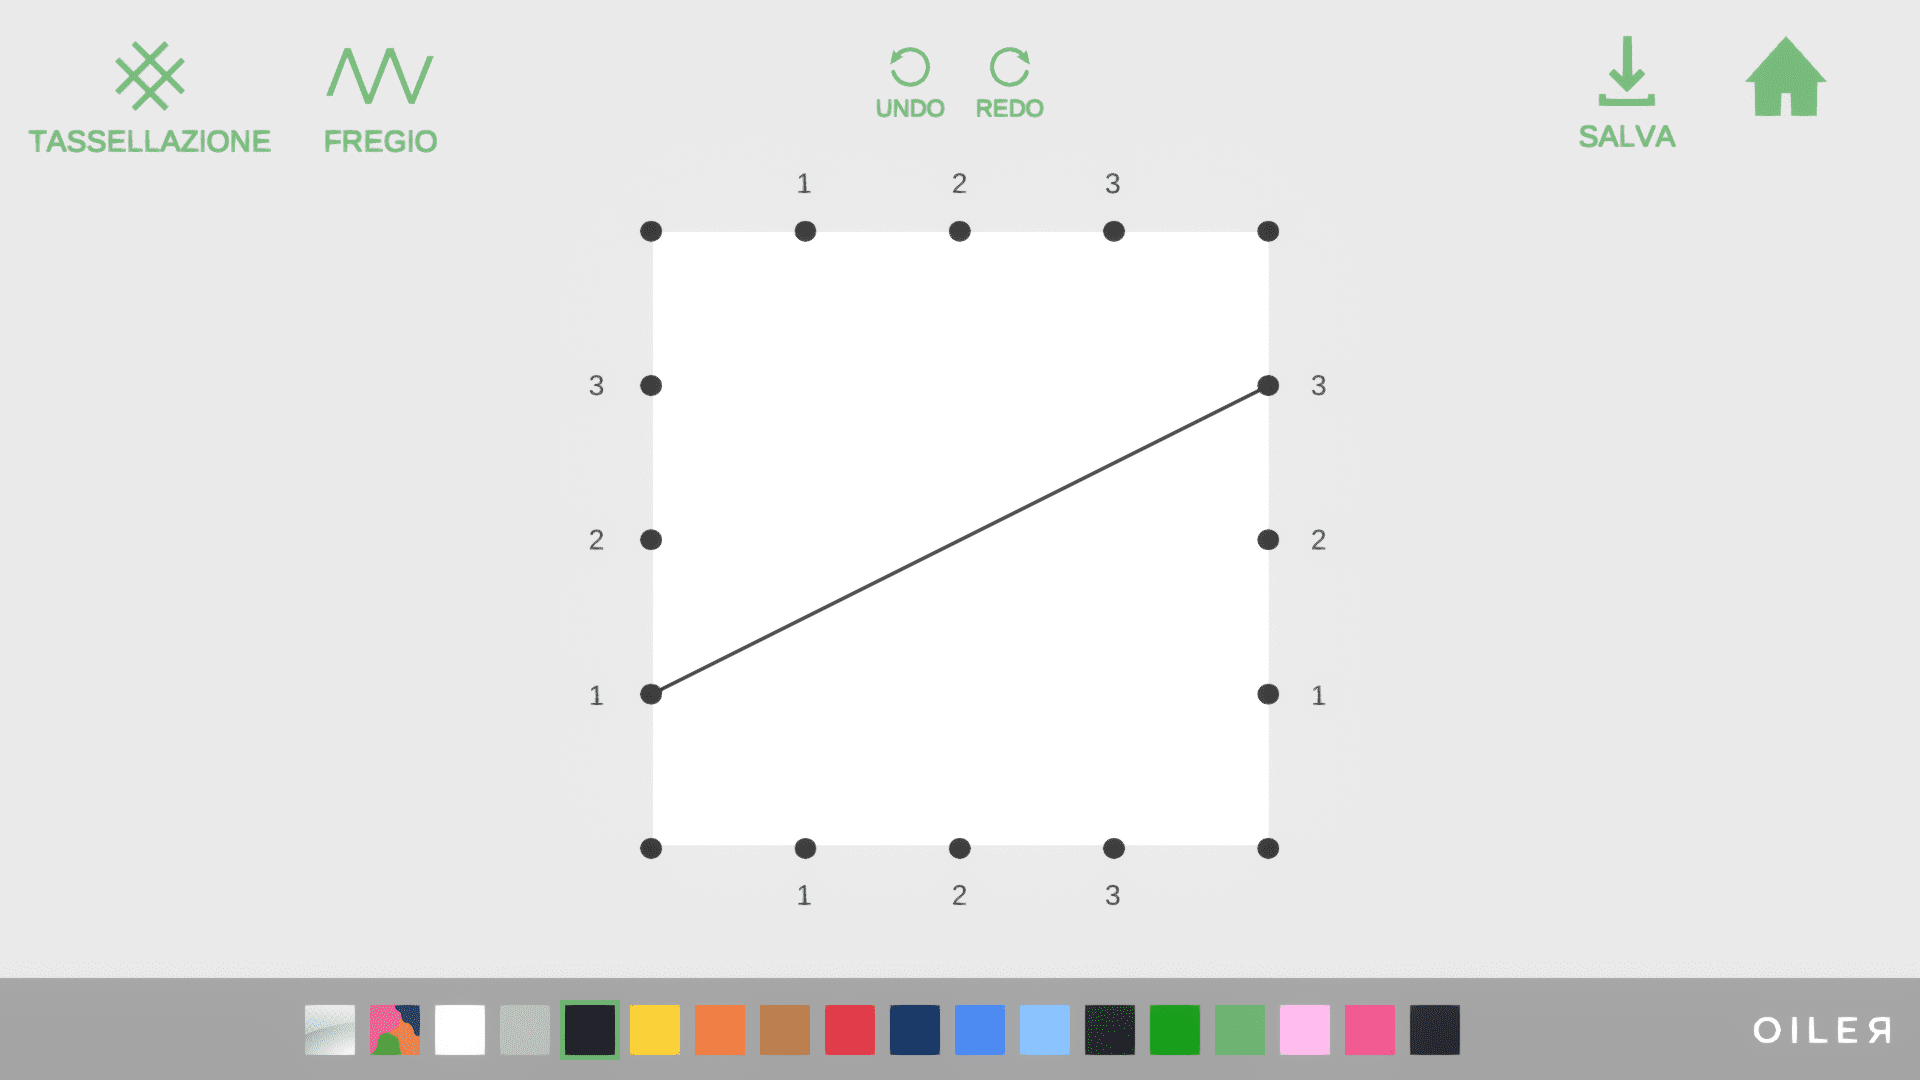
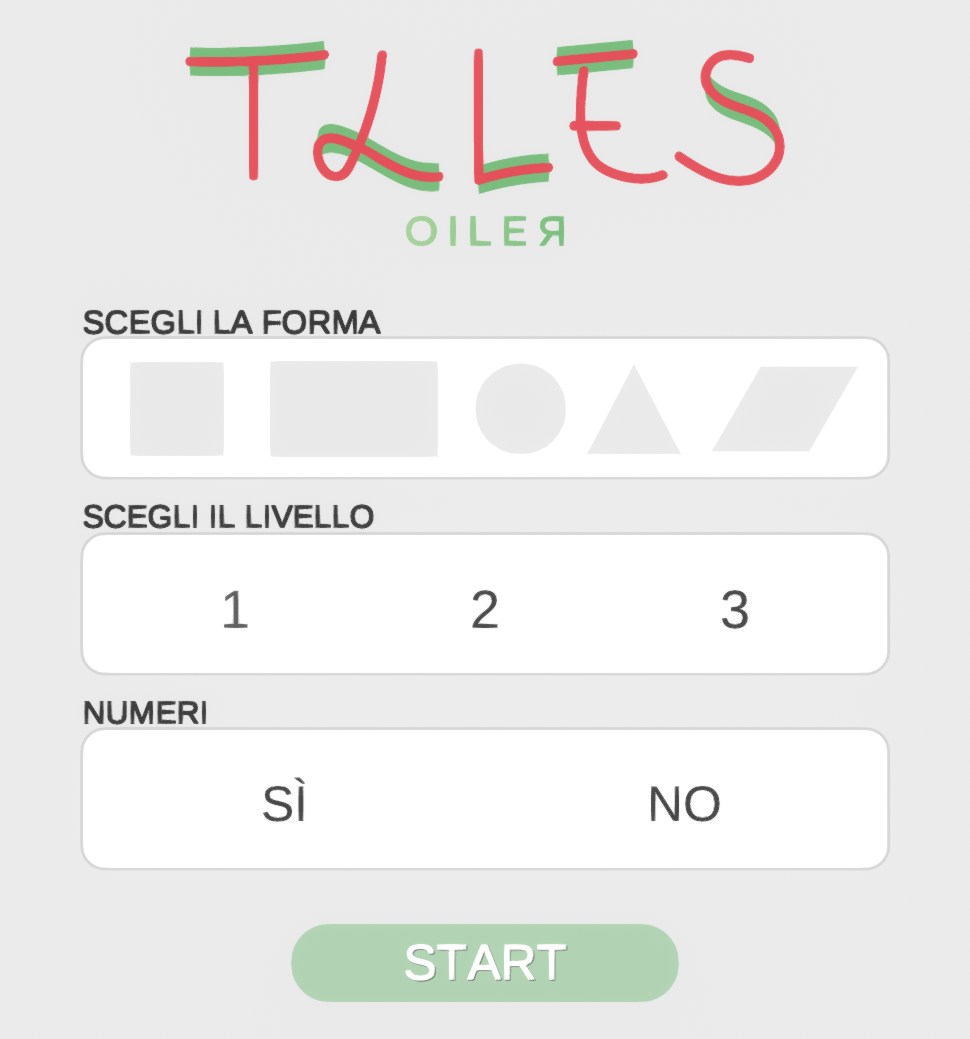
On the home page, you can choose the base shape for your configuration, the level, and whether or not to number the points along the shape’s edge. For your base shape, you can choose a square, rectangle, circle, equilateral triangle, or a rhombus made up of two equilateral triangles. The level corresponds to the distance between the points along the shape’s edge, with a higher level indicating a smaller distance and thus more points. Once you have chosen a shape, you can connect two points anywhere along the edge by clicking on one point and dragging the line that appears to another point.
The lines can be drawn in various colours: all you need to do is click on your chosen colour before drawing the line. To colour in the resulting sections of the plane, just click on a chosen section after having picked a colour. Among the default colours, there is also the palette option, which you can use to create your own custom colour. You can also choose the transparent option, to draw invisible lines.
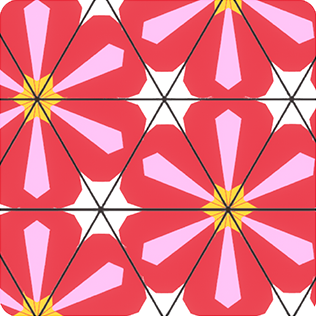
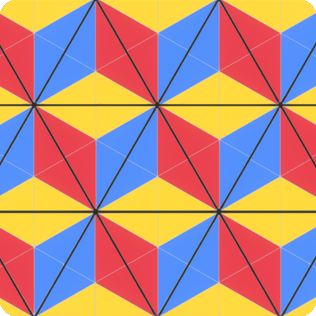
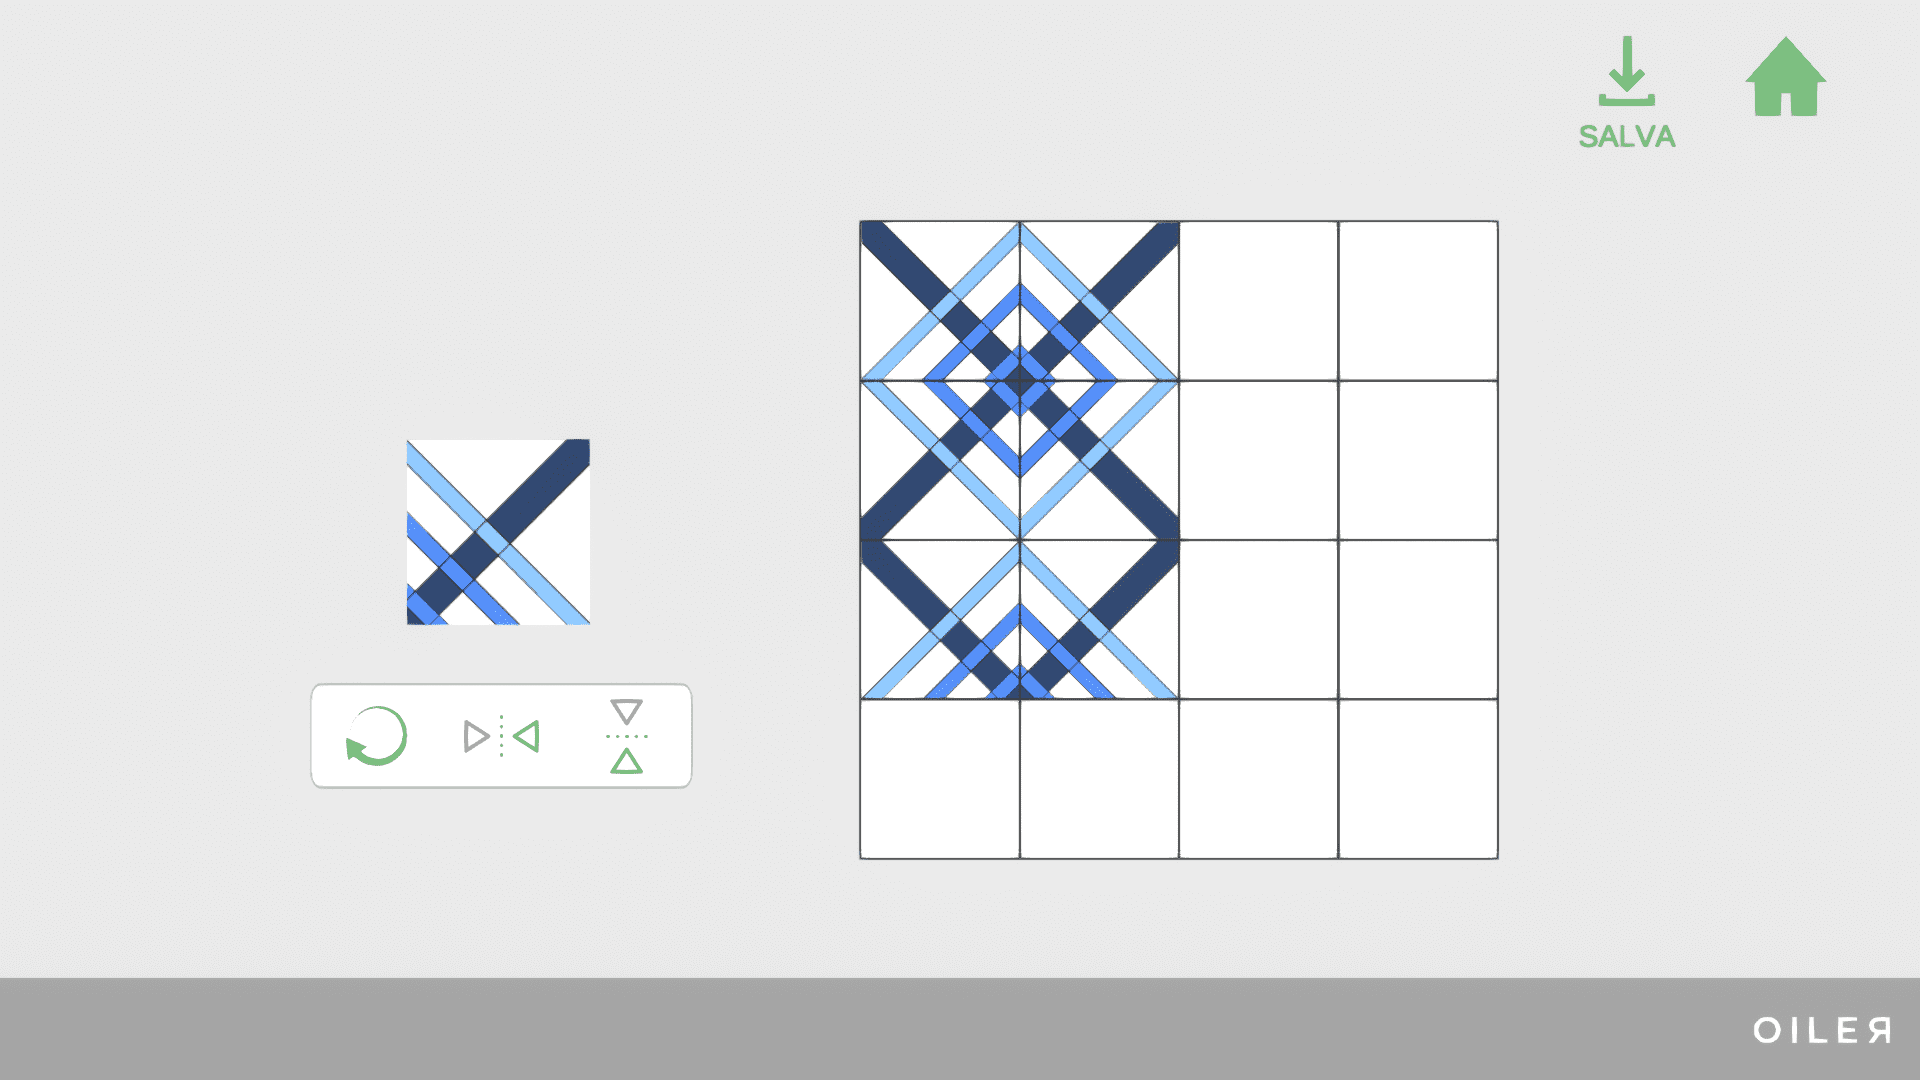
Once you have completed your configuration, you have the option to move onto the tessellation mode. Every tile, before being placed, can be rotated or reflected vertically or horizontally, using the buttons under the image of the tile on the left side of the screen. To place a tile, you simply need to click on the part of the grid you wish to place it. You can replace an existing tile with a new one by clicking it, but you cannot remove a tile that has been placed.
To save a configuration, or a tessellation, just click the button marked “SAVE”. Unfortunately, all this does is present your image alone on the screen, to make it easier to take a screenshot – to see how to take a screenshot, click here. The interface will go back as normal after few seconds.
MAIN CONSTRUCTIONS
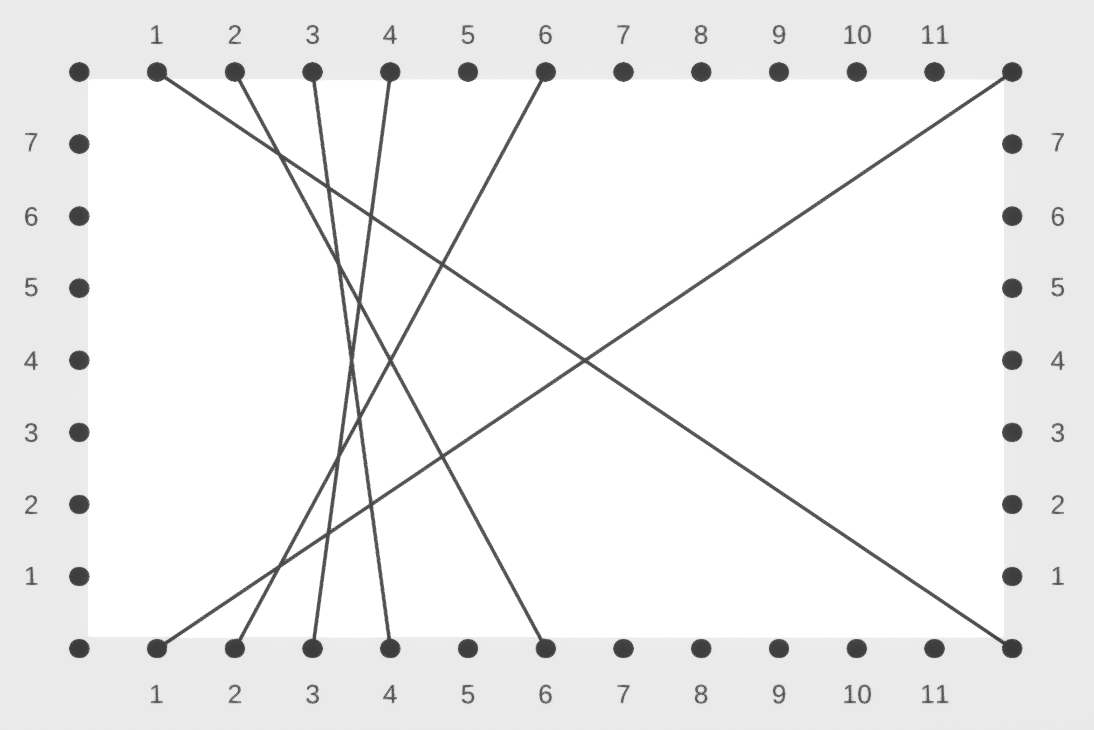
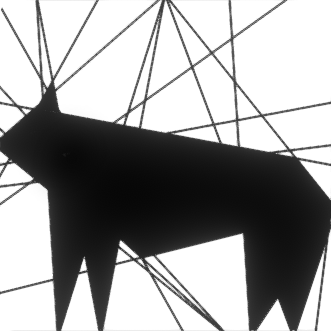
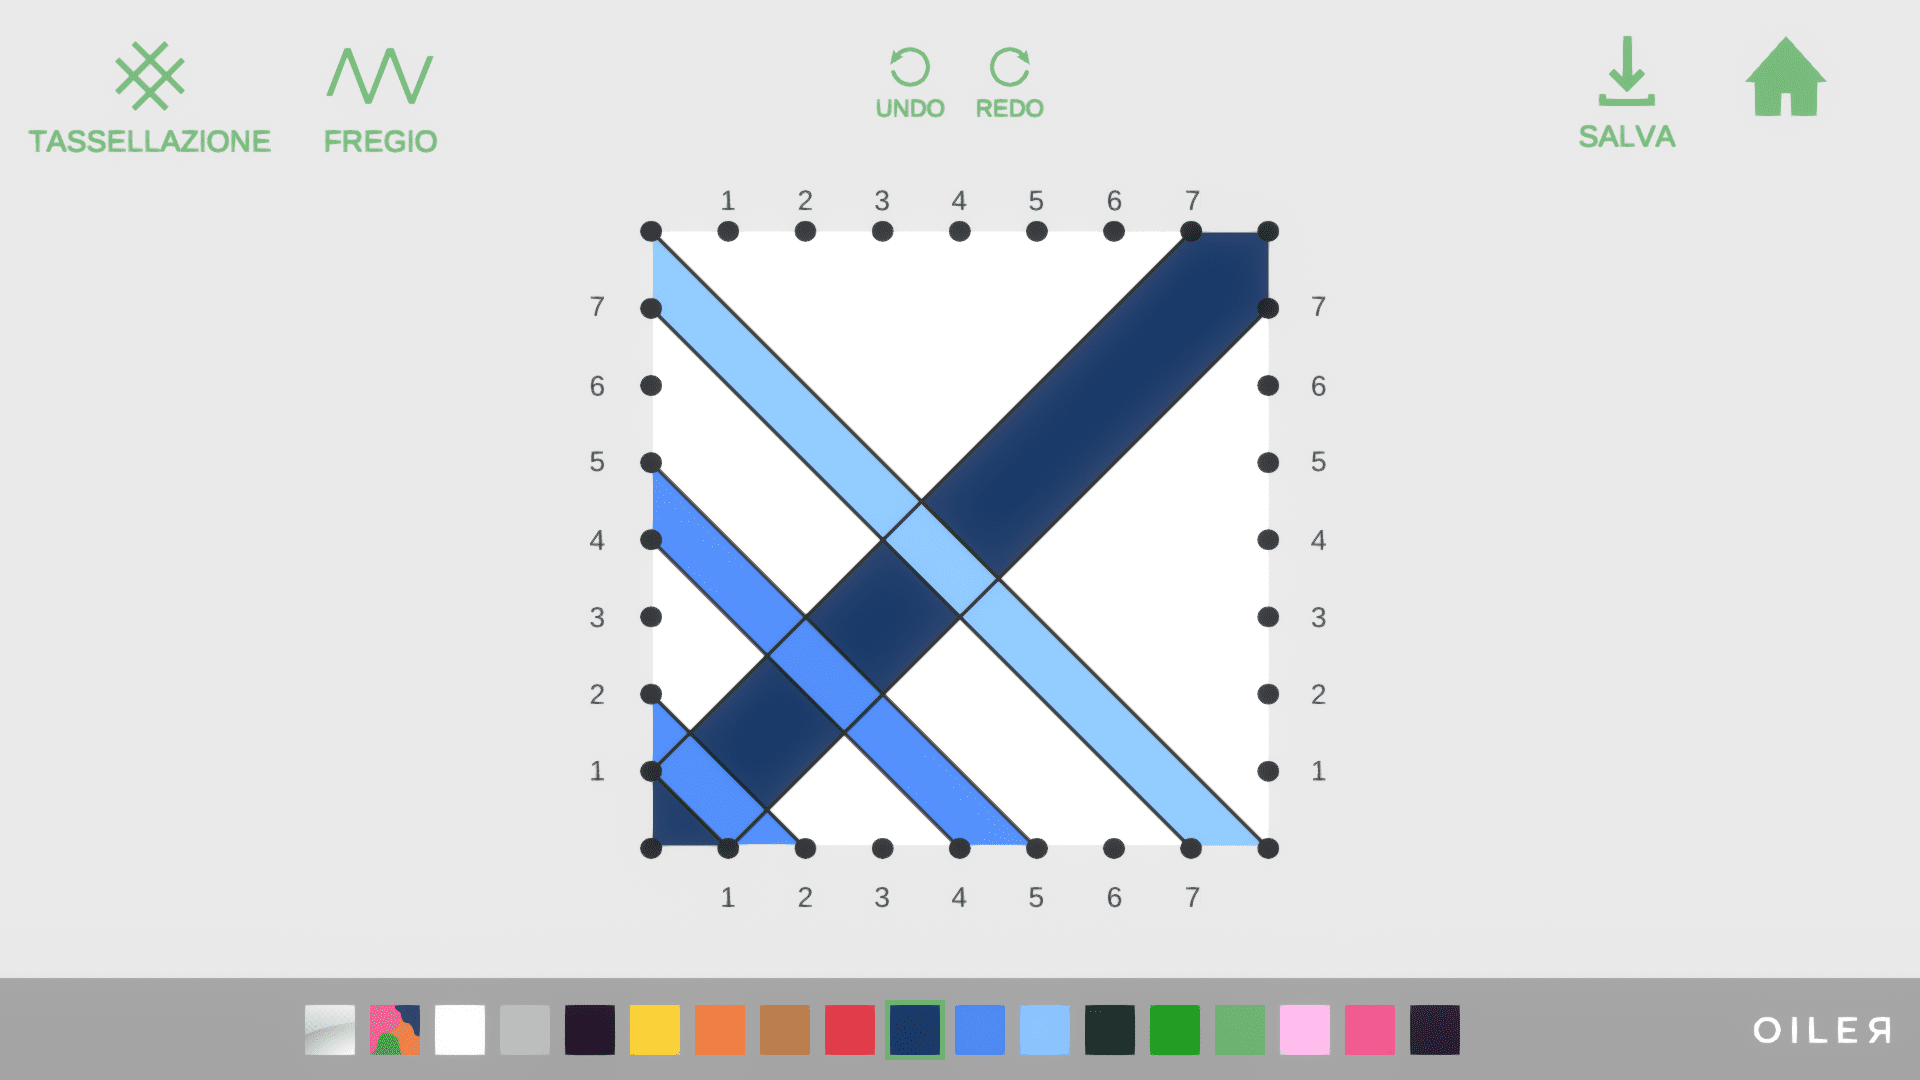
If you connect numbers on opposite sides of a shape that have a constant sum, you obtain a bundle of straight lines.
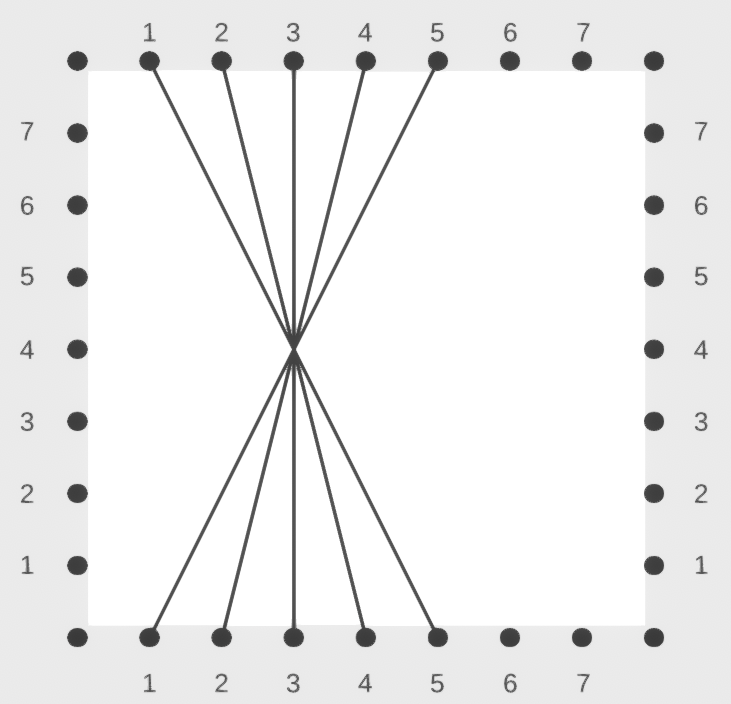
In the image, we have connected all pairs of numbers with a sum of 6, such as 1 and 5 or 2 and 4.
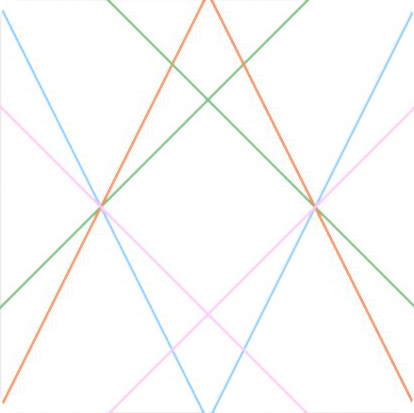
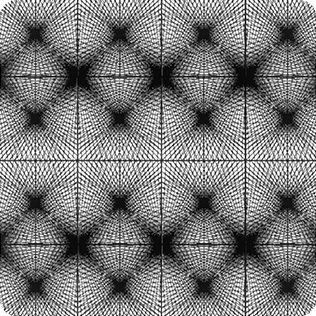
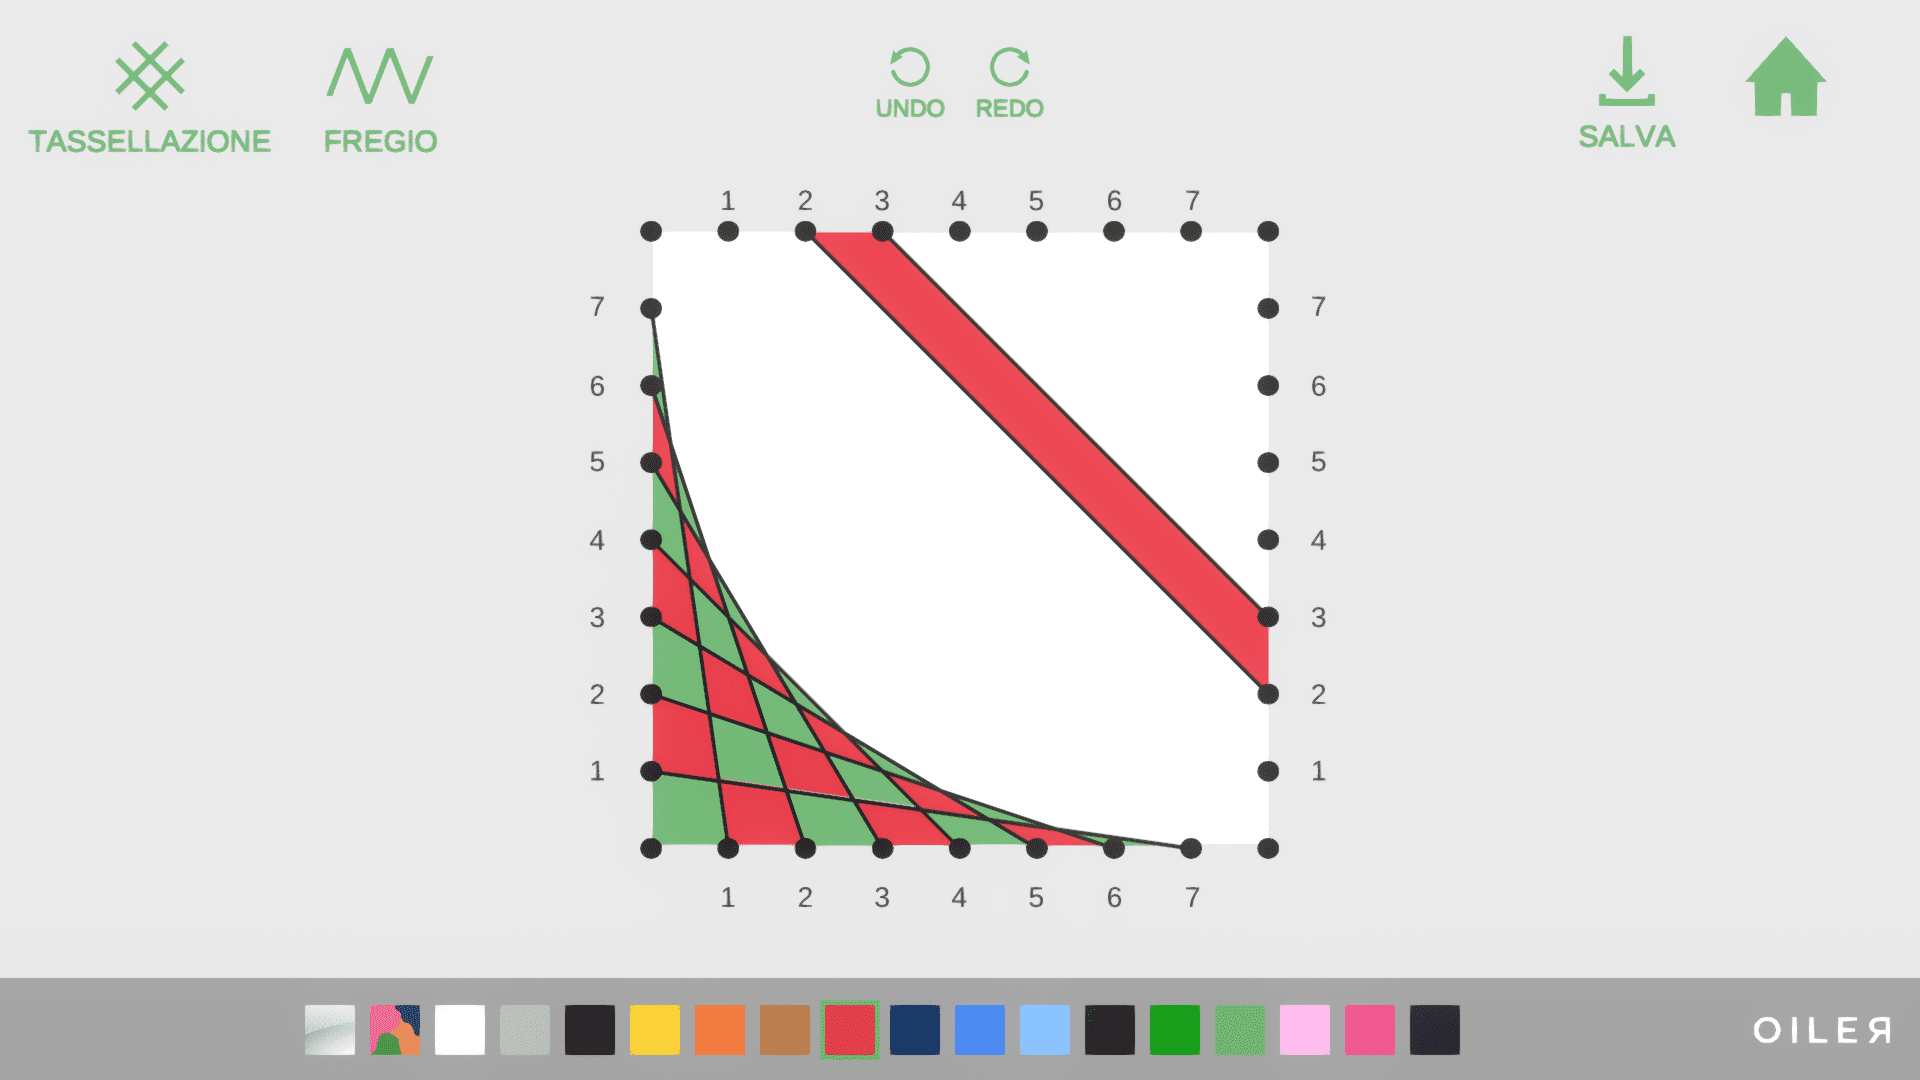
If you connect numbers on adjacent sides that have a constant sum, you obtain a parabola, as the envelope of the lines.
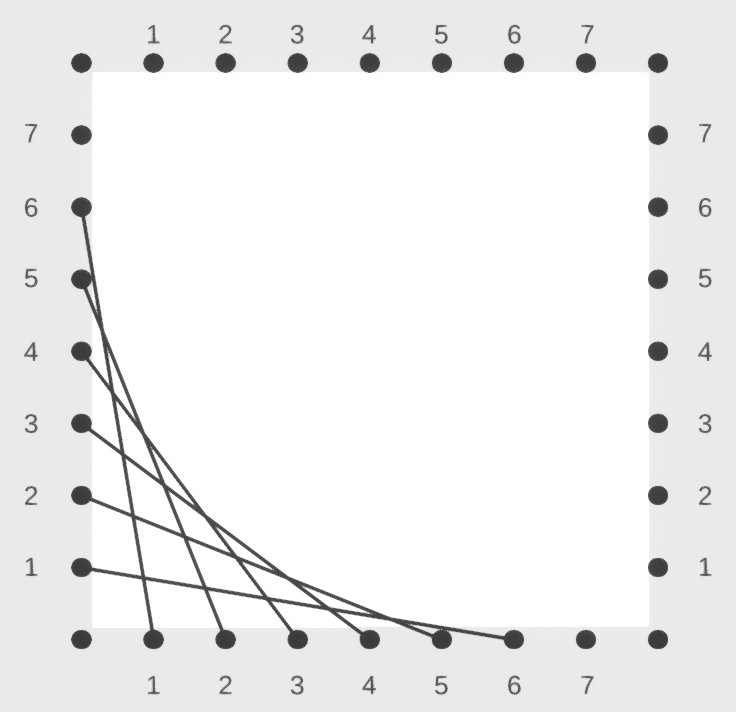
In the image, we have connected all pairs of numbers with a sum of 7, such as 1 and 6 or 2 and 5.
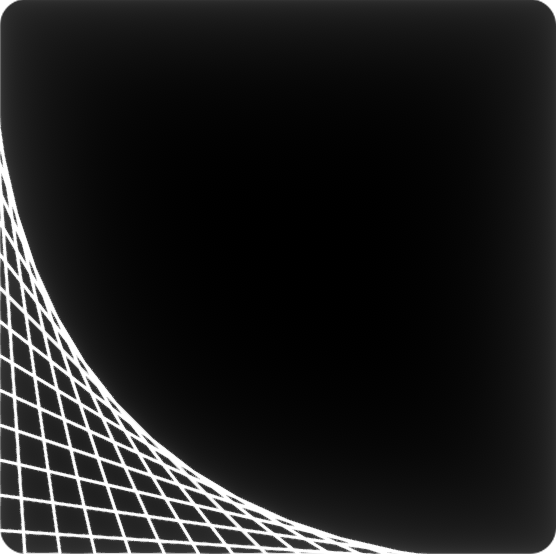
If you connect numbers on opposite sides that have a constant product, you obtain half of an ellipse, as the envelope of the lines.
In the image, we have connected all pairs of numbers with a product of 12, such as 1 and 12 or 2 and 6.


 More software